Mastering retail KPIs: from basics to AI-advanced insights

Retail KPI meaning
A Retail KPI is a specific performance metric that provides insights into how a retail business performs against its strategic goals. Companies can gain quantitative insights into their performance by tracking particular retail metrics over time. These insights offer visibility into what's working, what isn't, and where opportunities for improvement lie.
In this article we will focus on:
- Basic retail KPIs that help assess the performance of your offline business include setting clear sales goals and making detailed conclusions.
- You can get advanced retail KPIs with AI sensors installed in stores to collect analytics about the offline audience. Do in-depth analytics like for website traffic, but store traffic.
The use of KPIs in the retail sector is becoming increasingly crucial to provide insightful data analytics, which ranges from visitor traffic analysis to staff performance. Let's dive deeper!
KPIs for retail employee performance
In the retail industry, it is crucial to have key performance indicators (KPIs) in place to evaluate and monitor the performance of employees. These KPIs serve as benchmarks to measure the success and effectiveness of retail employees in their roles.
Sales conversion rate
This metric measures the percentage of customers who make a purchase. A high sales conversion rate indicates that the employee effectively influences customers to make a purchase, contributing to the business's overall success.
Customer satisfaction
This can be measured through surveys or feedback from customers. A high level of customer satisfaction indicates that the employee is providing exceptional service and meeting customer expectations, which leads to increased customer loyalty and repeat business.
Average transaction value
These metrics provide insights into an employee's ability to upsell and cross-sell.
Cons of sales approach
Unfortunately, there are several objections to basic metrics. For example, suppose a customer walks into a shop - doesn't know anything about the product, feels confused, doesn't find anything, and leaves. The second situation is when a customer comes in, an employee talks to him, and the customer looks at the goods and shelves but does not buy anything. If we proceed only from sales figures, the employee's efficiency in both cases is 0. Secondly, and no less important, customer satisfaction, what is the probability that negative feedback from a customer will reach the manager?
Employee's interaction with customers
With the help of AI sensors installed on the shelves in the store, you can identify interested or disinterested visitors, i.e., those who looked at the products for more than a specific time (which you can set yourself, based on the specifics of your field) or interacted with the products, and vice versa.
How does it help to determine the effectiveness of employees? If an employee approaches a visitor, offers help, talks about the brand or products, and creates a favorable atmosphere, the visitor is likely to linger in the shop and look at the shelves of products. If the employee does not approach, the visitor will walk around the shop, feel confused, and leave. Thus, KPIs for retail staff performance.
Leads and bounced conversion
Leads conversion. Look at the graph; if the total flow increases, the number of leads (interested visitors, those who interacted with the product or explored the shelves) should also increase.
Bounced conversion. If the situation is the opposite - the total flow has increased, but the number of leads has not, then we have a situation where the staff is not working efficiently, cannot cope with the load, or is busy with other tasks.
Allocation by day and hour helps to assess the situation most accurately and take appropriate action.

Essential retail KPIs for sales metrics
These KPIs enable retailers to evaluate the success of their sales strategies and make informed decisions to drive growth and profitability. Here are some of the critical sales-related KPIs that retailers should monitor.
Sales per square foot
Total net sales / Total square foot. This KPI measures a retail store's efficiency in generating revenue relative to its retail space. By measuring sales per square foot, you can assess the effectiveness of your merchandising strategies and make data-driven decisions to improve your stores' layout and product offerings.
Sales growth year over year
This metric compares the total revenue generated in the current year to the previous year, providing insight into the business's overall sales performance and growth trajectory. Retailers can use this KPI to assess the effectiveness of their sales strategies and identify improvement areas. For example, if sales growth year over year is declining or stagnant, it may indicate a need for new marketing initiatives or product innovations to attract customers and boost sales.
Sales per employee
Total net sales / Total employees. This metric calculates the revenue generated by each employee, helping retailers assess staffing levels and evaluate individual employee performance. This KPI also helps retailers identify any staffing gaps or overstaffed periods, enabling them to optimize their workforce and allocate resources effectively.
An entire offline sales funnel
The sales conversion rate is a crucial metric in measuring the success of a sales team or business. It refers to the percentage of leads or prospects successfully converted into paying customers. A high conversion rate indicates effective sales strategies and processes, while a low conversion rate may indicate areas for improvement.
For a deep understanding of conversion rates, you need to know not only how many people came in and how many made a purchase but also about each stage of your offline sales funnel. How many people came in, how many were interested in the product, i.e., looked at it on the shelves or interacted with it, and how many eventually made a purchase. Understanding the conversion rates of the intermediate stages gives a complete understanding of your sales funnel. It helps you determine the effectiveness of your marketing campaigns and merchandising and get to know your target audience more.
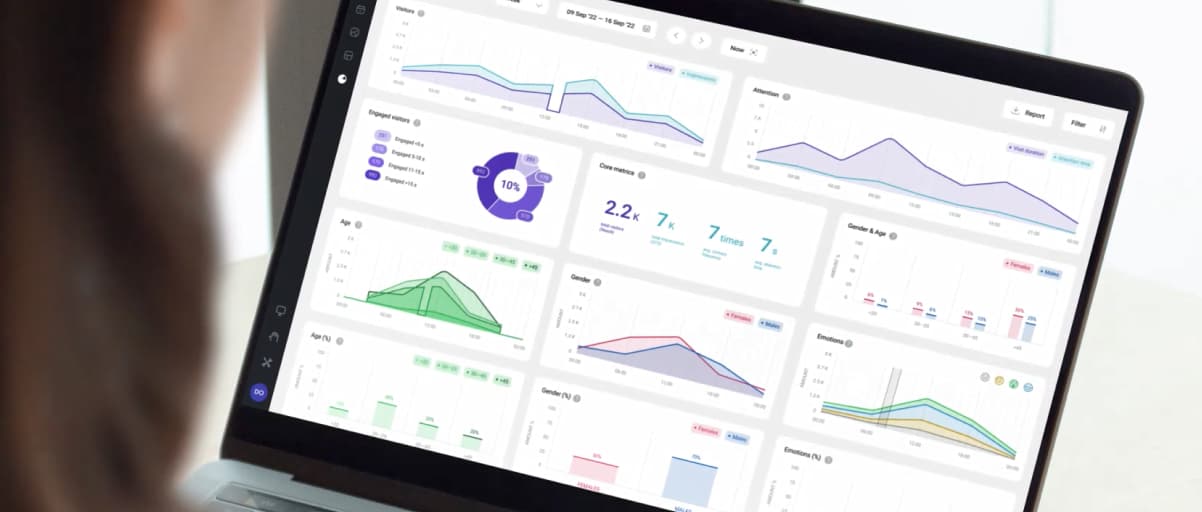
Engaged visitors
DISPL, with the help of AI sensors installed in the store, can identify engaged visitors. You can see an example of the collected analytics on the graph. The great potential lies in the fact that such analytics can be viewed for each of the departments or shelves of your store if DISPL sensors are installed there, helping to determine the conversion rate for each department.

Retail KPIs for understanding customers' behavior
By analyzing key performance indicators (KPIs), retailers can gain valuable insights into their customers' preferences, buying patterns, and overall satisfaction. These KPIs serve as a compass for retailers, guiding them in making informed decisions to improve customer experience and drive sales.
Customer satisfaction
This metric reflects how satisfied customers are with their overall shopping experience. By collecting feedback through surveys, reviews, or social media monitoring, retailers can assess whether their products, services, and customer support meet customers' expectations.
Customer retention rate
Metric measures the percentage of customers who continue shopping at a store over a period. By tracking this metric, retailers can assess the effectiveness of their loyalty programs and customer retention strategies. These KPIs provide valuable insights into customers' behavior and can help retailers make data-driven decisions to improve their business performance.
Visit duration
How do you know how comfortable your visitors are in your store? The most telling metric that determines this is the length of stay. This KPI can provide insights into customer engagement and satisfaction. A longer visit duration may indicate that customers are strolling in your store, making more and more spontaneous purchases. However, remember that excessive length of stay means your shop may need more straightforward navigation or long queues. By analyzing visit duration data, retailers can identify areas for improvement, such as store layout, product placement, or customer service training.

Store traffic
Foot traffic refers to the number of people who visit a retail store within a specific period. Monitoring foot traffic can help retailers understand their stores' popularity and the effectiveness of their marketing efforts. By analyzing foot traffic data, retailers can identify peak hours and days, which can help them optimize staffing levels and improve customer service. For example, if foot traffic is highest on weekends, retailers may consider scheduling more staff to ensure a smooth shopping experience for customers.

Store traffic by zones
But this graph from DISPL hides a few secrets. Firstly, you can see the unique number of visitors and the total number of visitors, i.e., if a person has visited twice. Secondly, the most significant benefit is that you can study the number of visitors in different areas of your shop (where you have installed sensors). Thanks to this, you can not just determine the interest in the store but the interest in each of the zones of the store, determining the attractiveness, effectiveness of merchandising, layout, and the most passable zones, i.e., the most marginal. There are a lot of possibilities!
Retail KPIs for understanding inventory performance
Inventory performance is a crucial aspect of any retail business as it directly impacts profitability and customer satisfaction. By tracking key performance indicators (KPIs), retailers can gain valuable insights into their inventory management and make informed decisions.
Inventory turnover
This metric calculates the number of times inventory is sold and replaced within a specific timeframe. A high inventory turnover ratio indicates that products sell quickly and efficiently, while a low ratio suggests slow-moving or obsolete inventory. By monitoring this KPI, retailers can identify popular products and adjust their purchasing strategies accordingly.
Stock-to-sales ratio
This metric compares the inventory on hand to the sales generated during a specific period. A high stock-to-sales ratio indicates excess inventory, which can lead to higher carrying costs and potential obsolescence. On the other hand, a low stock-to-sales ratio suggests insufficient inventory to meet customer demand, potentially resulting in lost sales. By monitoring this KPI, retailers can optimize their inventory levels and ensure they have the right stock to meet customer demand.
Shrinkage
Shrinkage measures how much inventory you've lost due to theft, administrative errors, or damages. High levels of shrinkage can significantly impact a retailer's bottom line.
By monitoring these metrics, retailers can make data-driven purchasing, stocking, and pricing decisions, ultimately improving inventory performance and customer satisfaction.
Retail KPIs for understanding transactional data
Keeping track of money flowing in and out of your business is crucial. Here are some essential financial KPIs that retailers should track:
Gross profit
Gross profit tells a business owner how much money they've earned after deducting product creation and sales costs.
Net profit
Net profit is the profit earned after all business expenses are accounted for.
Average transaction value
Total sales from transactions / Total distinct count of transactions. This KPI tells you how much people spend on your products on average. Higher transaction values indicate that people buy more or higher-value products from your store.
Closing thoughts
Retail KPIs provide a roadmap for retailers to understand their business performance and take corrective actions wherever necessary. By tracking the right KPIs, retailers can make informed decisions that enhance customer experience, increase sales, and improve overall store efficiency. By leveraging advanced tools like DISPL solutions, retailers can comprehensively understand their store's performance, customer behavior, and the effectiveness of their marketing and operational strategies. This data-driven approach enables informed decision-making with data analytics, ultimately leading to business growth and success in the competitive retail landscape.